
Bitcoin price gained pace for a move above $20,000 against the US Dollar. BTC is showing positive signs and might rise further above $20,500.
- Bitcoin started a steady increase above the $19,200 and $19,500 resistance levels.
- The price is trading above $20,000 and the 100 hourly simple moving average.
- There is a connecting bullish trend line forming with support near $20,000 on the hourly chart of the BTC/USD pair (data feed from Kraken).
- The pair is gaining pace and might rally further above the $20,500 level.
Bitcoin Price Gains Pace
Bitcoin price formed a base above the $19,000 level and started a steady increase. BTC was able to clear the $19,500 and $19,650 resistance levels.
The bulls were able to pump the price above the $20,000 resistance zone. The price traded as high as $20,475 and the price is now correcting gains. It is trading above $20,000 and the 100 hourly simple moving average. Bitcoin is now slowly moving lower below $20,400.
It is trading well above the 23.6% Fib retracement level of the upward move from the $18,937 swing low to $20,475 high. There is also a connecting bullish trend line forming with support near $20,000 on the hourly chart of the BTC/USD pair.
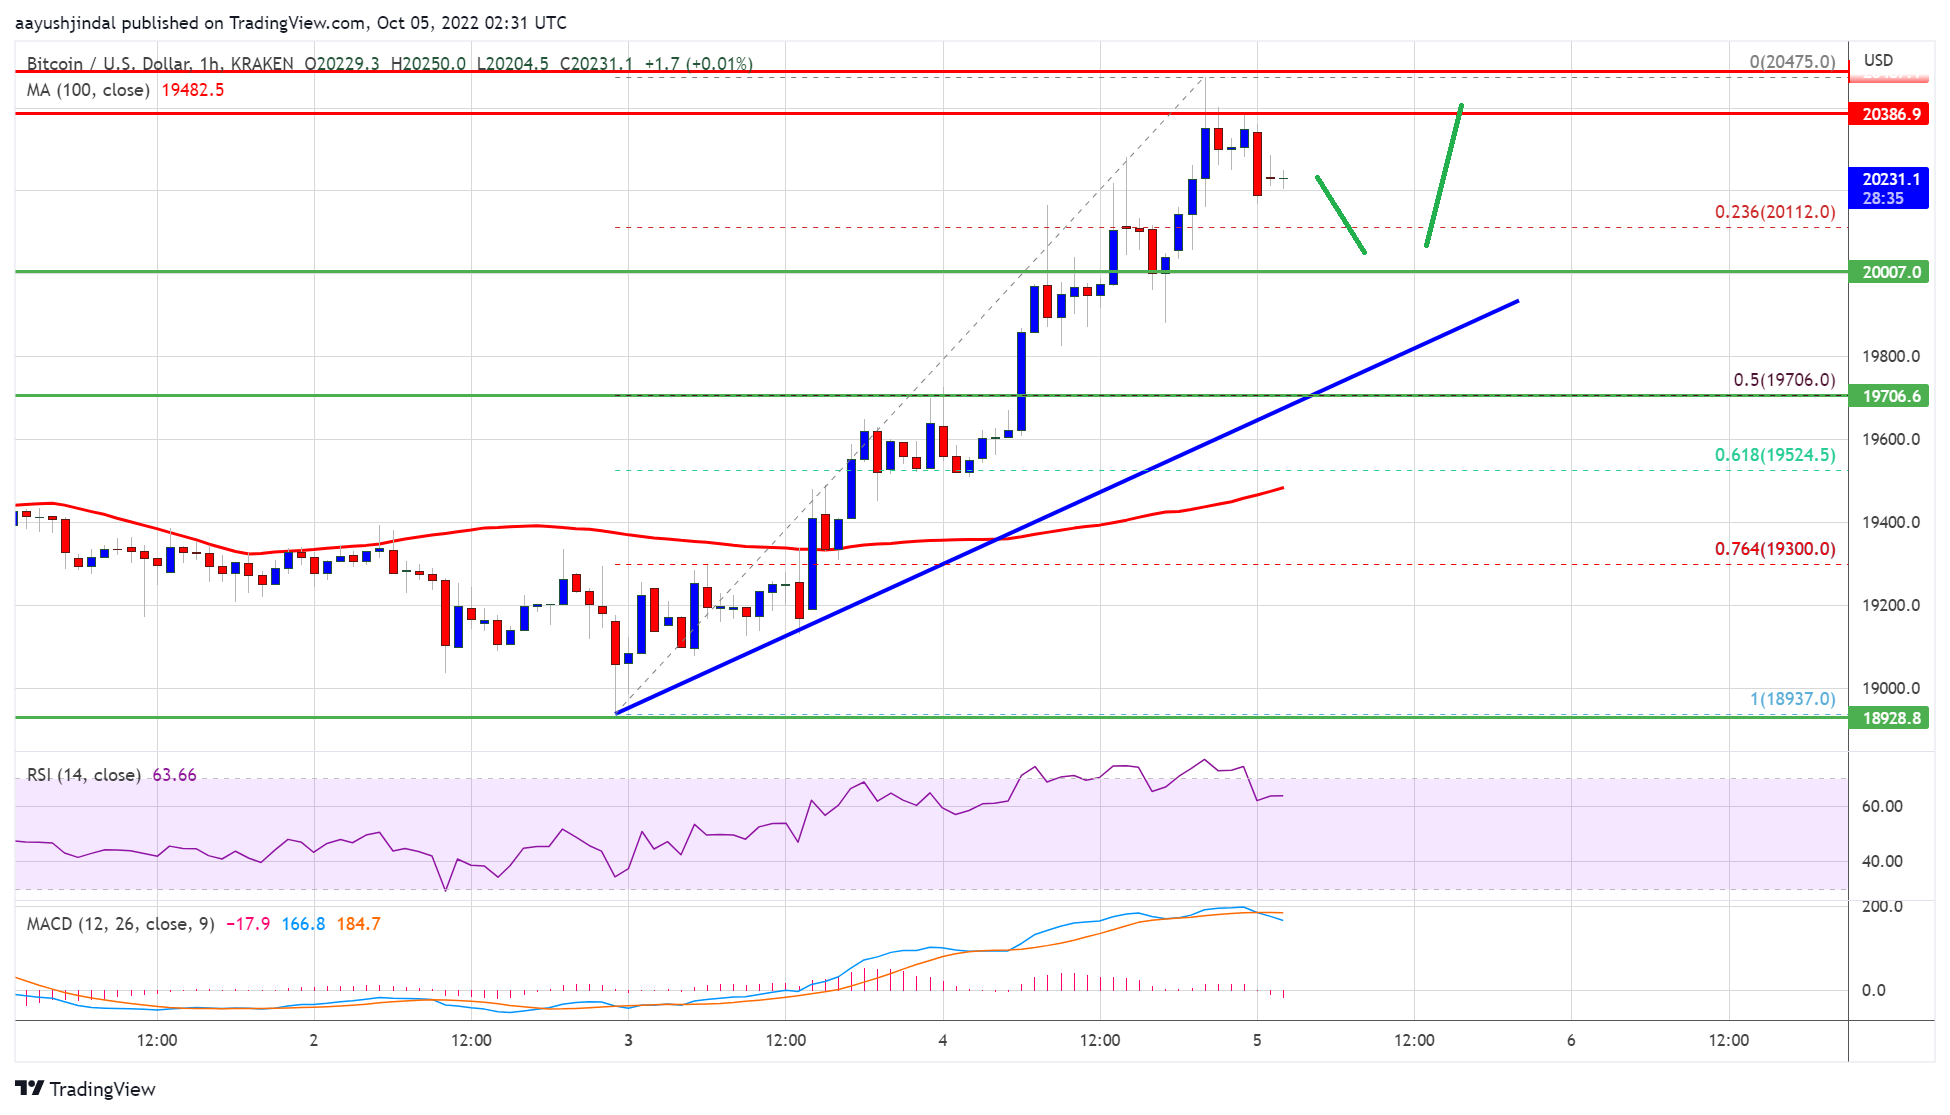
Source: BTCUSD on TradingView.com
On the upside, an immediate resistance is near the $20,450 level. The next major resistance sits near the $20,500 zone. A clear move above the $20,500 resistance might start another increase. In the stated case, the price could even surpass the $21,200 resistance zone. The next major resistance is near the $22,500 zone.
Dips Limited in BTC?
If bitcoin fails to rise above the $20,500 resistance zone, it could start a downside correction. An immediate support on the downside is near the $20,100 zone.
The next major support is near the $20,000 zone and the trend line. A downside break below the trend line might send the price towards $19,700. It is near the 50% Fib retracement level of the upward move from the $18,937 swing low to $20,475 high. The main support is near $19,500, below which the price might drop to $19,200.
Technical indicators:
Hourly MACD – The MACD is now gaining pace in the bullish zone.
Hourly RSI (Relative Strength Index) – The RSI for BTC/USD is now above the 50 level.
Major Support Levels – $20,100, followed by $20,000.
Major Resistance Levels – $20,500, $21,200 and $22,500.
