
Bitcoin price seems to be in the control of the bulls as the crypto has rallied. Over the last 24 hours, BTC gained more than 7% on its chart.
In the last week, the crypto’s gain has been more than 8%. This has put Bitcoin in a bullish position as it has managed to cross the $20,000 price mark.
The buyers are back on the one-day chart as the demand for the coin noted a considerable increase.
The bulls might be eyeing the next major resistance mark of $22,000, but there are two other important price levels that the coin has to zoom past.
If the buyers once again exit the market, a price pullback is on the chart. This change in the bullish momentum of Bitcoin has also fueled massive rallies for major altcoins in the market.
The next immediate trading sessions will prove to be vital for the coin as they could decide the further strength of the bulls. A fall from the current price mark will bring BTC back to the $19,000 price zone.
Bitcoin Price Analysis: One-Day Chart
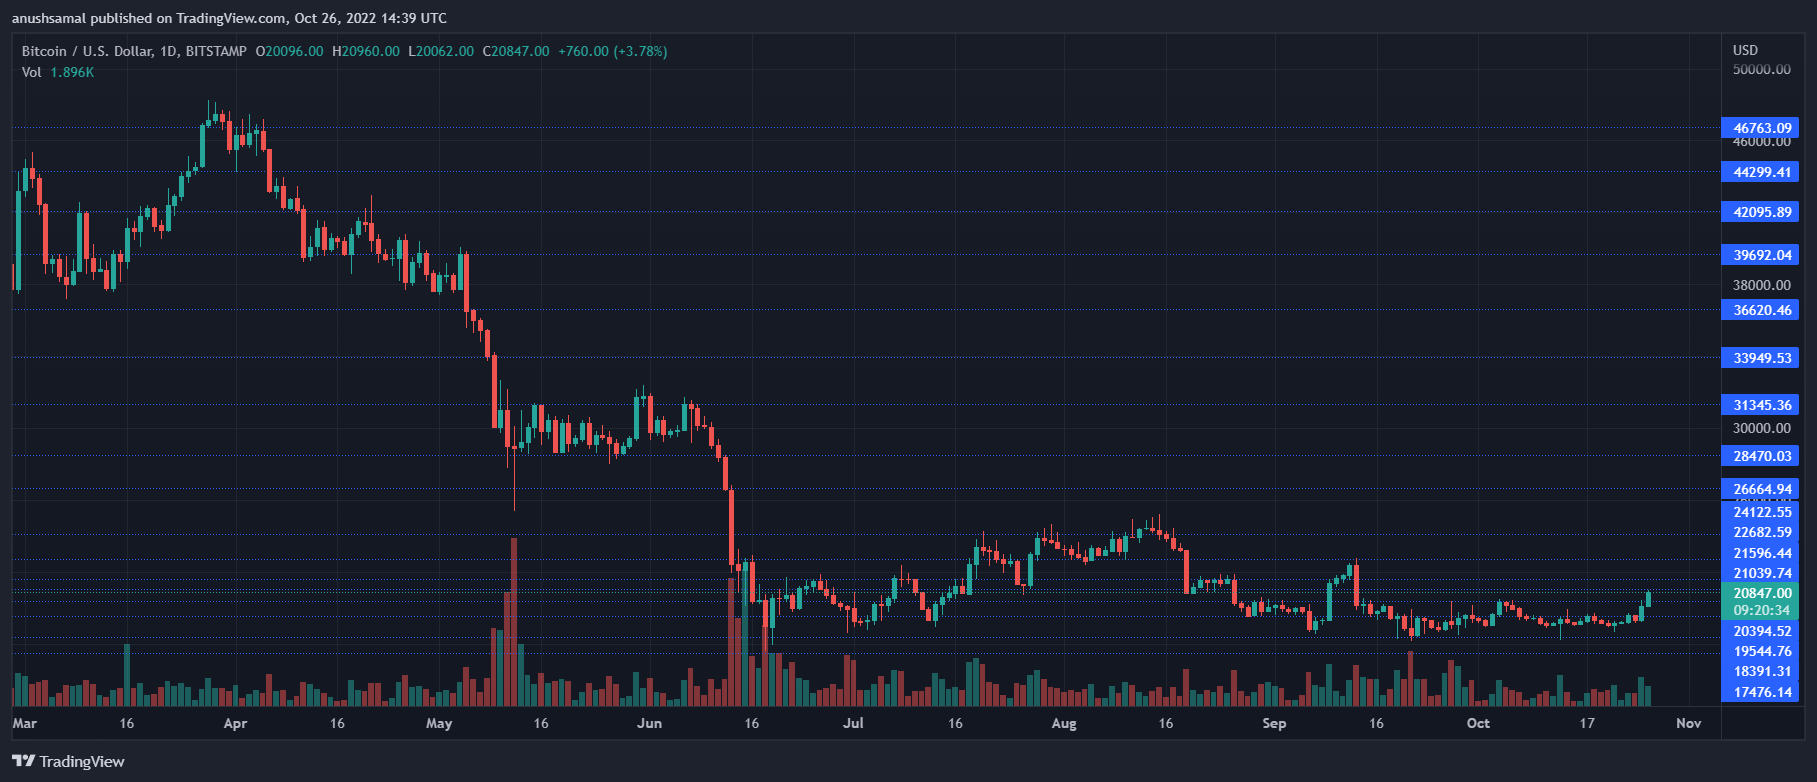
BTC was trading at $20,800 at the time of writing. The coin has finally been able to break past its long consolidation phase.
Now that the range-bound movement of the coin has ceased, there are important price levels that Bitcoin price has to topple over in order to reach the $22,000 price level.
Immediate resistance for the coin was at $21,100 and the other price level stood at $21,600. If the bulls lose momentum or in the case of a price pullback, Bitcoin price will fall back to $19,700.
The $19,600 still acts as strong support for the coin. The amount of Bitcoin traded in the past session grew, indicating that buying strength also registered a substantial uptick.
Technical Analysis
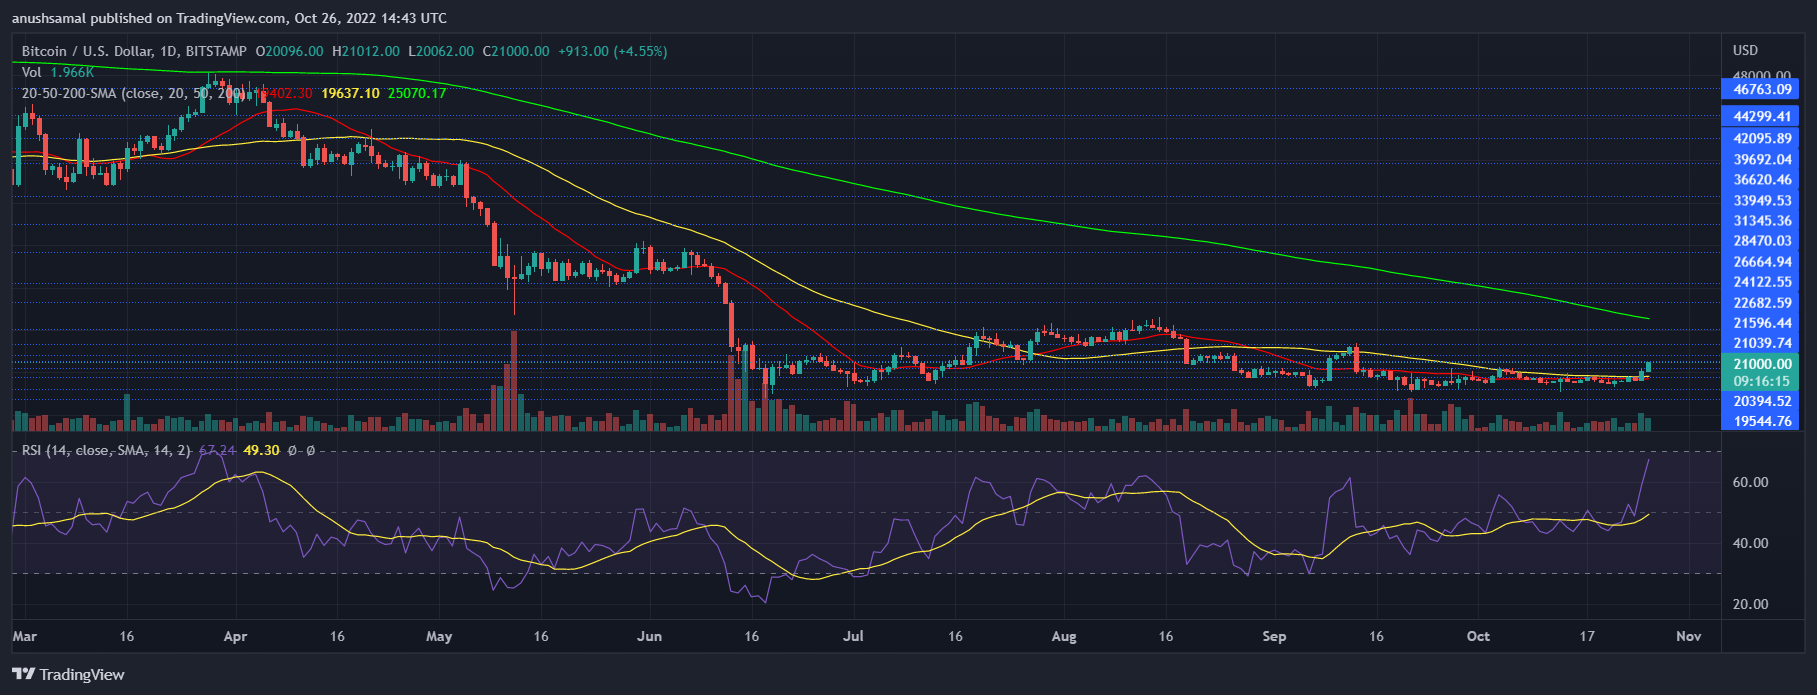
The technical indicator sided with the bulls. The cryptocurrency was moving closer to the overvalued zone, as seen on the one-day chart.
The Relative Strength Index shot past the half-line and moved above the 60-mark, which is considered quite bullish for the coin.
With continued bullish momentum, Bitcoin price could enter the overbought zone. A move into the overvalued and overbought zone could cause a price correction too.
Bitcoin price was above the 20-SMA, which signalled more demand, and buyers were in charge of driving the price momentum.
BTC has shown that the buyers have certainly gained strength as it also portrayed buy signal on its chart.
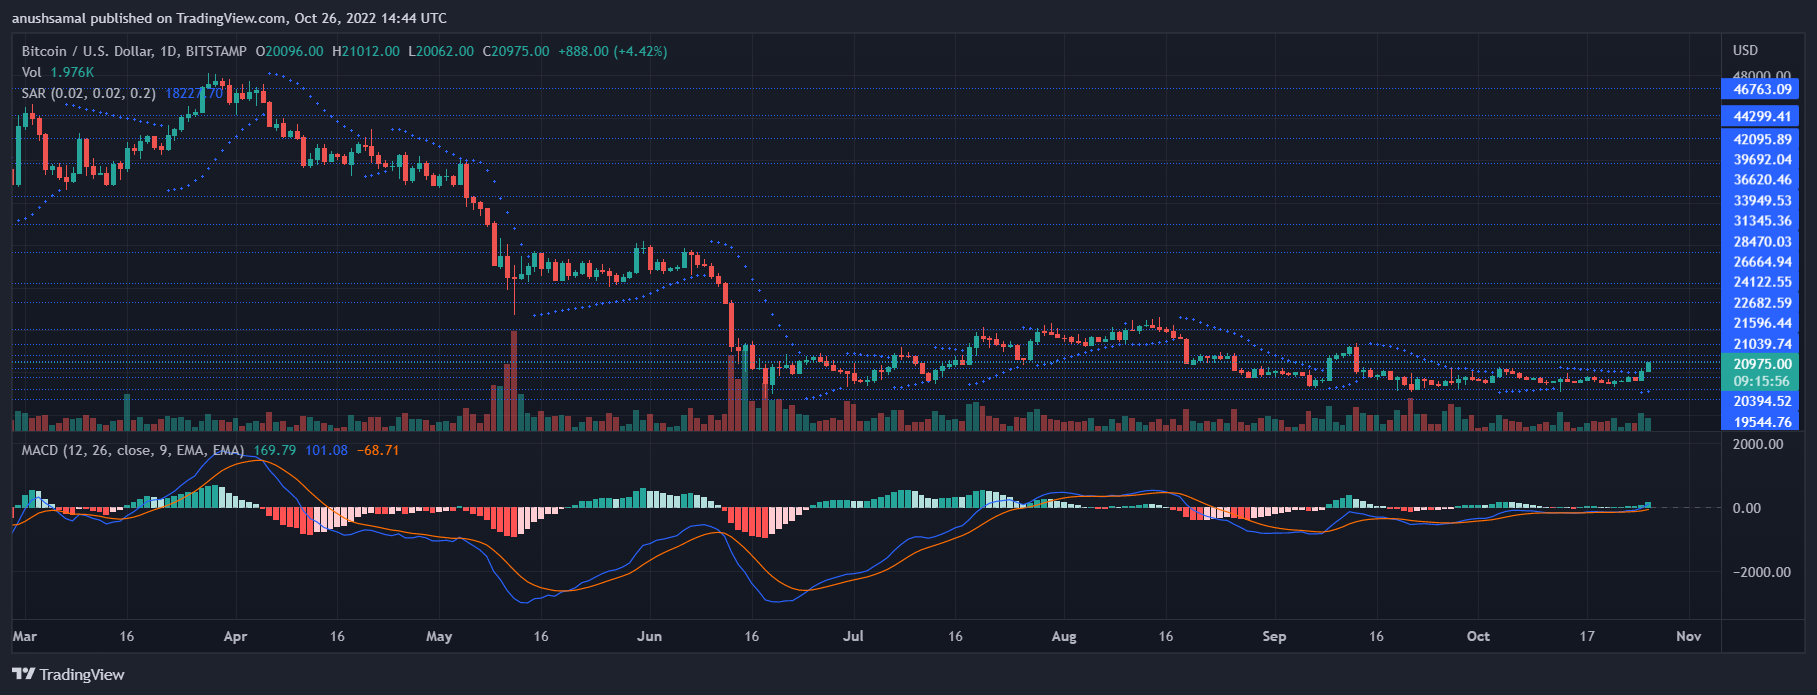
The Moving Average Convergence Divergence indicates the overall price direction and strength of the momentum.
The MACD formed green signal bars, which were the buy signal, and they were increasing in size, signifying bullish price action.
The Parabolic SAR depicts the price trend and direction too. The dotted lines were below the price candlestick, which is a mark of positive price action.
