
Bitcoin price started a downside correction from $21,000 against the US Dollar. BTC is stable above $20,000 and might start a fresh increase.
- Bitcoin is holding gains above the $20,000 and $20,200 levels.
- The price is trading above $20,000 and the 100 hourly simple moving average.
- There is a key bearish trend line forming with resistance near $20,440 on the hourly chart of the BTC/USD pair (data feed from Kraken).
- The pair could start another upward move if there is a clear move above the $20,500 resistance.
Bitcoin Price Reaches Key Support
Bitcoin price started a fresh increase above the $20,000 and $20,500 resistance levels. BTC even traded above the $20,800 level and tested the $21,000 resistance zone.
A high was formed near $21,021 before there was a downside correction. The price declined below the $20,800 and $20,500 levels. It even broke the 23.6% Fib retracement level of the key increase from the $19,266 swing low to $21,021 high.
Bitcoin price is now trading above $20,000 and the 100 hourly simple moving average. It seems to be holding gains above the $20,000 and $20,200 levels.
The price also tested the 50% Fib retracement level of the key increase from the $19,266 swing low to $21,021 high. On the upside, an immediate resistance is near the $20,400 zone. There is also a key bearish trend line forming with resistance near $20,440 on the hourly chart of the BTC/USD pair.
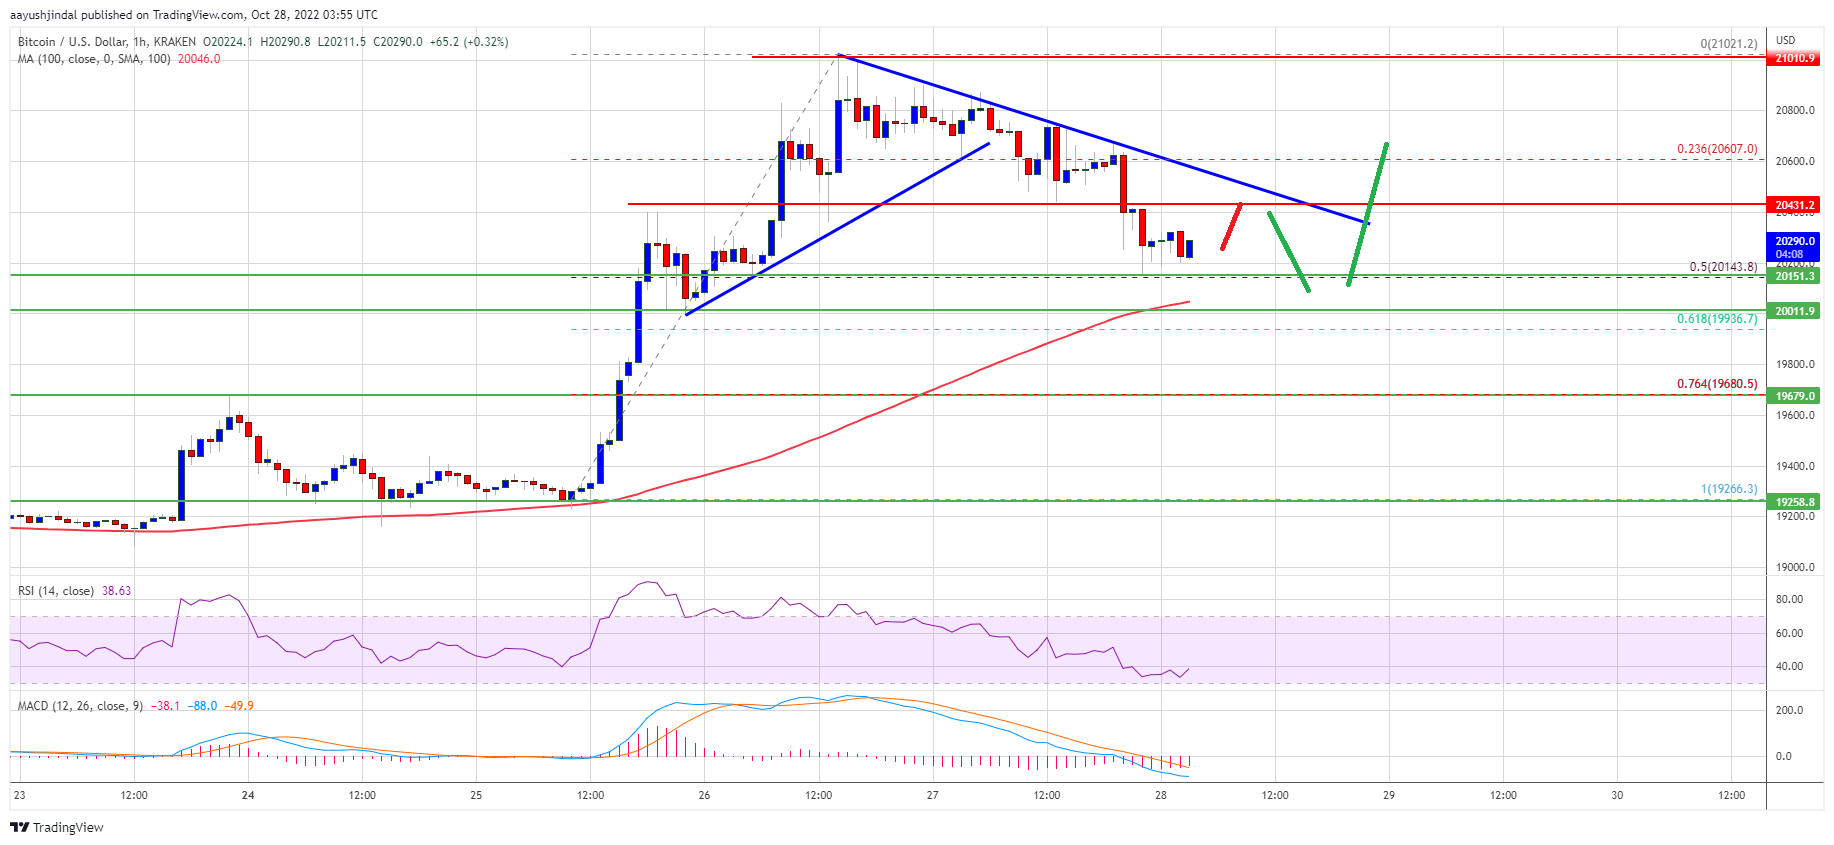
Source: BTCUSD on TradingView.com
The first major resistance sits near the $20,500 level and the trend line. The next major resistance might be $21,000. A clear move above the $21,000 resistance might send the price towards the $22,000 resistance. Any more gains open the doors for a test of the $22,500 resistance zone.
More Losses in BTC?
If bitcoin fails to rise above the $20,500 resistance zone, it could continue to move down. An immediate support on the downside is near the $20,150 zone.
The next major support is near the $20,000 zone and the 100 hourly simple moving average. A downside break and close below $20,000 might open the doors for a move towards the $19,500 support zone.
Technical indicators:
Hourly MACD – The MACD is now gaining pace in the bearish zone.
Hourly RSI (Relative Strength Index) – The RSI for BTC/USD is now below the 50 level.
Major Support Levels – $20,200, followed by $20,000.
Major Resistance Levels – $20,400, $20,500 and $21,000.
