This article is featured in Bitcoin Magazine’s “The Halving Issue”. Click here to get your copy. It is also report #1 of the “FUD Fighters” series powered by HIVE Digital Technologies LTD.
F%$K Bad Research: I spent over a month analyzing a bitcoin mining study and all I got was this trauma response.
“We must confess that our adversaries have a marked advantage over us in the discussion. In very few words they can announce a half-truth; and in order to demonstrate that it is incomplete, we are obliged to have recourse to long and dry dissertations.” — Frédéric Bastiat, Economic Sophisms, First Series (1845)
“The amount of energy needed to refute bullshit is an order of magnitude bigger than that needed to produce it.” — Williamson (2016) on Brandolini’s Law
For too long, the world has had to endure the fallout of subpar academic research on bitcoin mining’s energy use and environmental impact. The outcome of this bullshit research has been shocking news headlines that have turned some well-meaning people into angry politicians and deranged activists. So that you never have to endure the brutality of one of these sloppy papers, I’ve sacrificed my soul to the bitcoin mining gods and performed a full-scale analysis of a study from the United Nations University, published recently in the American Geophysical Union’s Earth’s Future. Only the bravest and hardest of all bitcoin autists may proceed to the following paragraphs, the rest of you can go back to watching the price chart.
Your soft baby ears might have screamed with shock at the strong proclamation in my lede that the biggest and squeakiest research on bitcoin mining is bullshit. If you’ve ever read Jonathan Koomey’s 2018 blog post on the Digiconomist–also known as Alex deVries, or his 2019 Coincenter report, or Lei et al. 2021, or Sai and Vranken 2023, or Masanet et al. 2021, or… Well, the point is that there’s thousands of words already written that have shown that bitcoin mining energy modeling is in a state of crisis and that this is not isolated to bitcoin! It’s a struggle that data center energy studies have faced for decades. People like Jonathan Koomey, Eric Masanet, Arman Shehabi, and those nice guys Sai and Vranken (sorry, we’re not yet on a first-name basis) have written enough pages that could probably cover the walls of at least one men’s bathroom at every bitcoin conference that’s happened last year, that show this to be true.
My holy altar, which I keep in my bedroom closet, is a hand-carved, elegant yet ascetic shrine to Koomey, Masanet, and Shehabi for the decades of work they’ve done to improve data center energy modeling. These sifus of computing have made it all very clear to me: if you don’t have bottom-up data and you rely on historical trends while ignoring IT device energy efficiency trends and what drives demand, then your research is bullshit. And so, with one broad yet very surgical stroke, I swipe left on Mora et al. (2018), deVries (2018, 2019, 2020, 2021, 2022, and 2023), Stoll et al. (2019), Gallersdorfer et al. (2020), Chamanara et al. (2023), and all the others that are mentioned in Sai and Vranken’s comprehensive review of the literature. World, let these burn in one violent yet metaphorically majestic mega-fire somewhere off the coast of the Pacific Northwest. Reporters, and policymakers, please, I implore you to stop listening to Earthjustice, Sierra Club, and Greenpeace for they know not what they do. Absolve them of their sins, for they are but sheep. Amen.
Now that I’ve set the mood for you, my pious reader, I will now tell you a story about a recent bitcoin energy study. I pray to the bitcoin gods that this will be the last one I ever write, and the last one you’ll ever need to read, but my feeling is that the gods are punishing gods and will not have mercy on my soul–even in a bull market. One deep breath (cue Heath Ledger’s Joker) and Here… We… Go.
On a somewhat bearish October afternoon, I got tagged on Twitter/X on a post about a new bitcoin energy use study from some authors affiliated with the United Nations University (Chamanara et al., 2023). Little did I know that this study would trigger my autism so hard that I would descend into my own kind of drug-induced-gonzo-fear-and-loathing-in-vegas state, and hyper-focus on this study for the next four weeks. While I am probably exaggerating about the heavy drug use, my recollection of this time is very much a techno-colored, toxic relationship-level fever dream. Do you remember Frank from the critically acclaimed 2001 film, Donnie Darko? Yeah, he was there, too.
As I started taking notes on the paper, I realized that Chamanara et al.’s study was really confusing. The paper was perplexing because it’s a poorly designed study that bases its raison d’etre entirely on de Vries and Mora et al. It uses the Cambridge Center for Alternative Finance (CCAF) Cambridge Bitcoin Energy Consumption Index (CBECI) data without acknowledging the limitations of the model (see Lei et al. 2021 and Sai and Vranken 2023 for an in-depth analysis of the issues with CBECI’s modeling). It conflates its results from the 2020-2021 period with the state of bitcoin mining in 2022 and 2023. The authors also relied on some environmental footprint methodology that would make you think it was actually possible for you to shrink or grow a reservoir depending on how hard you Netflix and chill. Really, this is what Obringer et al. (2020) inferentially conclude is possible and the UN study cites Obringer as one of its methodological foundations. By the way, Koomey and Masanet did not like Obringer et al.’s methodology, either. I’ll light another soy-based candle at the altar in their honor.
Here’s a more clearly stated enumeration of the crux of the problem with Chamanara et al. (and by the way, their corresponding author never responded to my email asking for their data so I could, you know, verify, not trust. 🥴):
The authors conflated electricity use across multiple years, overreaching on what the results could reveal based on their methods.
The authors used historical trends to make present and future recommendations despite extensive peer-reviewed literature clearly showing that this leads to overestimates and exaggerated claims.
The paper promises an energy calculation that will reveal bitcoin’s true energy use and environmental impact. They use two sets of data from CBECI: i) total monthly energy consumption and ii) average hashrate share for the top ten countries where bitcoin mining is operated. Keep in mind that CBECI relies on IP addresses that are tracked at several mining pools. CBECI-affiliated mining pools represent an average of 34.8% of the total network hashrate. So, the data used likely have fairly wide uncertainty bars.
After about an hour or so of Troy Cross talking me off a rather impressive, art deco and weather-worn ledge that’s probably seen a few Great Gatsby flappers jump–a result of feeling an overwhelming sense of terror after my exasperated self realized that no amount of cognitive behavioral therapy would get me through this study–I determined the equation that the authors used to calculate the energy use shares for each of the top ten countries with the most share of hashrate (based on the IP address estimates) had to be the following:
Don’t let the math scare you. Here’s an example of how this equation works. Let’s say China has a shared share for January 2020 of 75%. Then, let’s also say that the total energy consumption for January 2020 was 10 TWh (these are made-up numbers for simplicity’s sake). Then, for one month, we’d find that China used 7.5 TWh of energy. Now, save that number in your memory palace and do the same operation for February 2020. Next, add the energy use for January to the energy use found for February. Do this for each subsequent month until you’ve added up all 12 months. You now have CBECI’s China’s annual energy consumption for 2020.
Before I show the table with my results, let me explain another caveat to the UN study. This study uses an older version of CBECI data. To be fair to the authors, they submitted their paper for review before CBECI updated their machine efficiency calculations. However, this means that Chamanara et al.’s results are not even close to realistic because we now believe that CBECI’s older model was overestimating energy use. Moreover, to do this comparison, I was limited to data through August 31, 2023, because CBECI switched to the new model for the rest of 2023. To get this older data, CCAF was generous and shared it with me upon request.
| Country | 2020 Energy Consumption (TWh) | 2021 Energy Consumption (TWh) | 2020 + 2021 Energy Consumption (TWh) | Chamanara et al.’s 2020 + 2021 Energy Consumption (TWh) | Percent Change Between 2020 + 2021 Calculations (%) |
|---|---|---|---|---|---|
|
Mainland China |
44.45 |
32.89 |
77.34 |
73.48 |
5.25 |
|
United States |
4.65 |
25.20 |
29.85 |
32.89 |
-9.24 |
|
Kazakhstan |
3.18 |
12.06 |
15.24 |
15.94 |
-4.39 |
|
Russia |
4.71 |
7.59 |
12.29 |
12.28 |
0.081 |
|
Malaysia |
3.31 |
4.13 |
7.44 |
7.29 |
2.06 |
|
Canada |
0.80 |
5.25 |
6.05 |
6.62 |
-8.61 |
|
Iran |
2.33 |
3.06 |
5.39 |
5.13 |
4.82 |
|
Germany |
0.67 |
3.31 |
3.98 |
4.18 |
-4.78 |
|
Ireland |
0.62 |
2.69 |
3.31 |
3.43 |
-3.50 |
|
Singapore |
0.31 |
1.13 |
1.43 |
1.56 |
-0.083 |
|
Other (Excluding Singapore) |
3.69 |
6.73 |
10.42 |
10.63 |
-1.98 |
|
Total |
68.72 |
104.04 |
172.76 |
173.42 |
-0.38 |
Another tricky thing about this study is that they combined the energy use for both 2020 and 2021 into one number. This was really tricky because if you look at their figures, you’ll notice that the biggest text states, “Total: 173.42 TWh”. It’s also slightly confusing because the figure caption states, “2020-2021”, which for many people would be interpreted as a period of 12 months, not 24 months. Well, whatever. I broke them up into their individual years so everyone could see the steps that were taken to get to these numbers.
Look at the far right column with the header, “Percent Change Between 2020 + 2021 Calculations (%)”. I calculated the percent change between my calculations and Chamanara et al.’s. This is rather curious, isn’t it? Based on my conversations with the researchers at CCAF, the numbers should be identical. Maybe the changelog doesn’t reflect a smaller change somewhere, but our numbers are slightly different nonetheless. China has a greater share and the United States has a smaller share in the data that CCAF shared with me compared to the UN study. Despite this, the totals are fairly close. So, let’s give the authors the benefit of the doubt and say that they did a reasonable job calculating the energy share, given the limitations of the CBECI model. Please bear in mind that noting that their calculation was reasonable doesn’t mean that it’s reasonable to use these historical estimates to make claims about the present and future and direct policy. It isn’t.
One evening while working by candlelight, I glanced to my left and saw Frank’s stabbing, black pupils (the Donnie Darko character I mentioned earlier) staring at me like two pieces of Stronghold waste coal, fixed in a quiet bed of pearly sand. He was reminding me that this report was still not finished and something about time travel. I grabbed my extra-soft curls (I switched to bar shampoo, it’s a godsend for frizz) and yanked as hard as I could. Willie Nelson’s 1974 Austin City Limits pilot episode blasting on my cheap-ass Chinese knock-off monitor’s mono speakers was moving through my ears like heroin through Lou Reed’s 4-lanes wide network of veins. Begrudgingly, I accepted my fate. I needed to go deeper down this rabbit hole. I needed to do a deeper analysis of the 2020 and 2021 CBECI data to show how important it is to do an annual analysis and not blur the years into one calculation. Realizing I was out of my hard liquor of choice, a splash of sherry in a Shirley Temple (shaken, not stirred), I grabbed a bottle of bootleg antiseptic that I got during the pandemic lockdown and chugged.
I flipped through my notes. I have lots of notes because I’m a serious person. What about the mining map issues? Can we do this through an analysis of the two separate years? What was happening for each of the ten countries? Does that tell us anything about where hashrate went after the China ban? What about the Kazakhstan crackdown? That’s post-2021, but the UN study acts like it never happened when they’re talking about the current mining distribution…
Not to the authors’ credit, they failed to mention to the peer-reviewers and to their readers that the mining map data only goes through January 2022. So, even though they talk about bitcoin mining’s energy mix as if it represents the present, they are completely wrong. Their analysis only captures historical trends, not the present and definitely not the future.
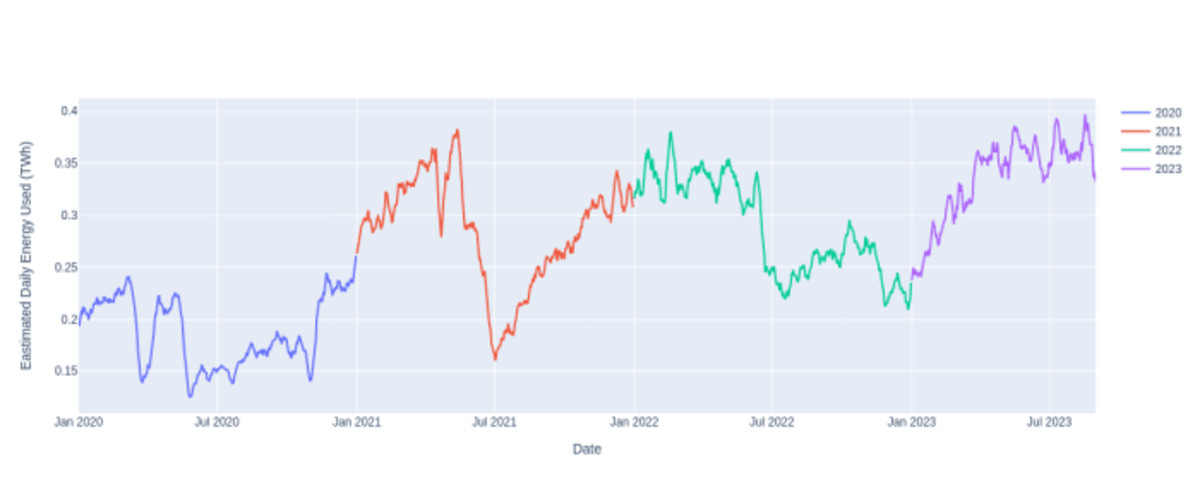
See this multi-colored plot of CBECI’s estimated daily energy use (TWh) from January 2020 through August 31, 2023? At this macro scale, we see plenty of variability. But also it’s apparent just from inspection that each year is different from the next in terms of variability and energy use. There are a number of possible reasons for the cause of variability at this scale. Some possible influences on energy use could be bitcoin price, difficulty adjustment, and machine efficiency. More macroscale influences could be as a result of regulation, such as the Chinese bitcoin mining ban that occurred in 2021. Many of the Chinese miners fled the country for other parts of the world, Kazakhstan and the United States are two countries where hashrate found refuge. In fact, the power of the Texas mining scene really came to be at this unprecedented moment in hashrate history.
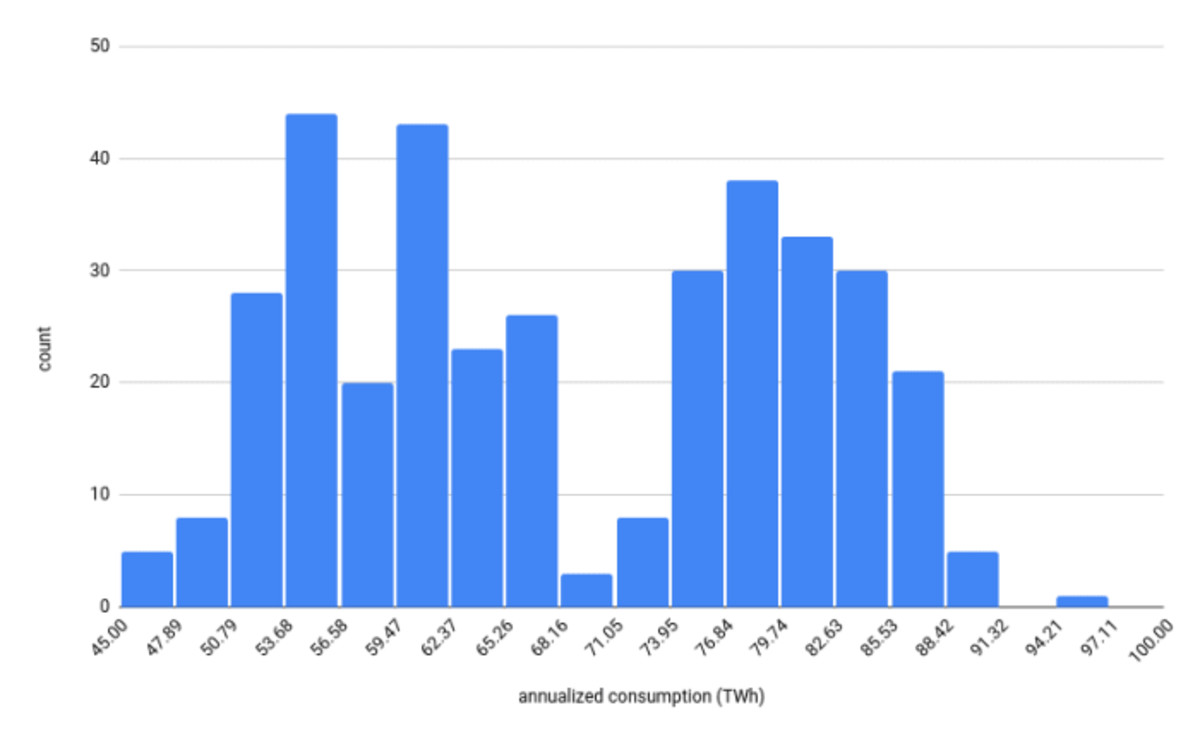
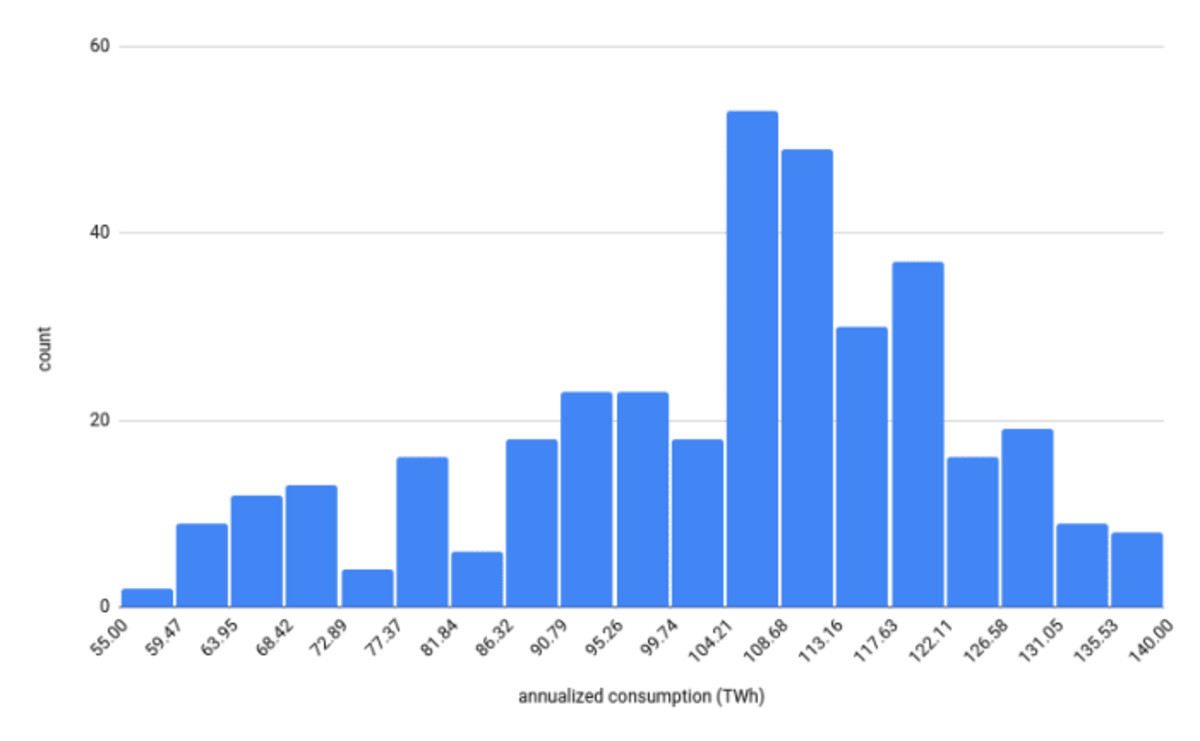
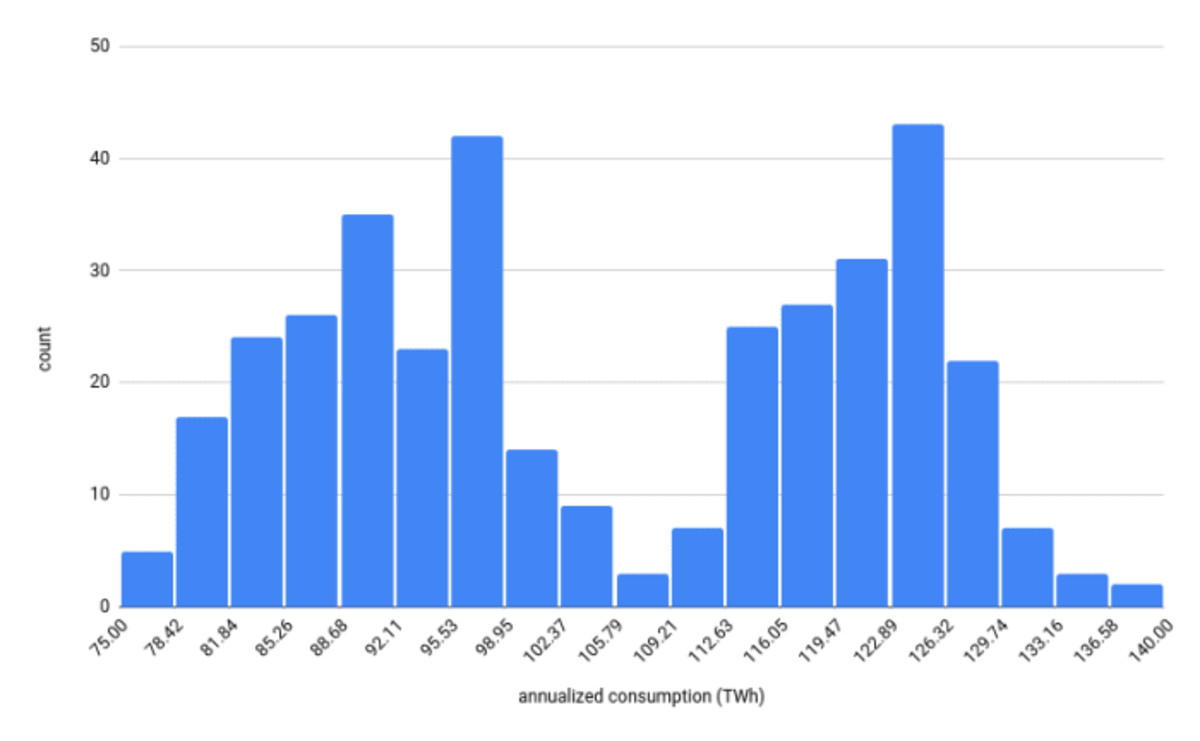
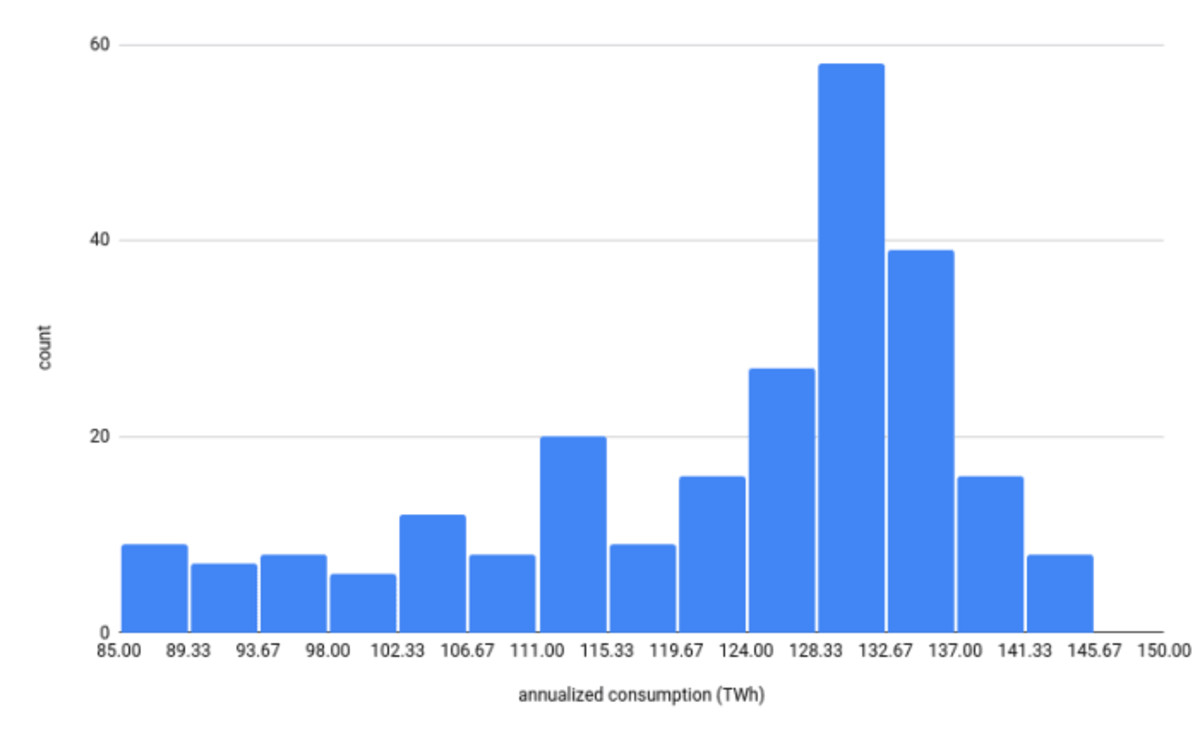
Look at the histograms for 2020 (top left), 2021 (top right), 2022 (bottom left), and 2023 (bottom right). It’s obvious that for each year, the estimated annualized energy consumption data shows different distributions. Even though we do see some possible distribution patterns, we have to be careful not to take this as a pattern that happens every four-year cycle. We need more data to be sure. For now, what we can say is that some years in our analysis show a bimodal distribution while other years show a kind of skewed distribution. The main point here is to show that the statistics for energy use for each of these four years are different, and distinctly so for the two years that were used in Chamanara et al.’s analysis.
In the UN study, the authors wrote that bitcoin mining exceeded 100 TWh per year in 2021 and 2022. However, if we look at the histograms of the daily estimated annualized energy consumption, we can see that daily estimates vary quite a bit, and even in 2022 there were many days where the estimated energy consumption was below 100 TWh. We’re not denying that the final estimates were over 100 TWh in the older estimated data for these years. Instead, we’re showing that because bitcoin mining’s energy use is not constant from day to day or even minute-to-minute, it’s worth doing a deeper analysis to understand the origin of this variability and how it might affect energy use over time. Lastly, it’s worth noting that the updated data now estimates the annual energy use to be 89 TWh for 2021 and 95.53 TWh for 2022.
One last comment, Miller et al. 2022 showed that operations (specifically buildings) with high variability in energy use over time are generally not suitable for emission studies that use averaged annual emission factors. Yet, that’s what Chamanara et al. chose to do, and what so many of these bullshit models tend to do. A good portion of bitcoin mining doesn’t operate like a constant load, Bitcoin mining can be highly flexible in response to many factors from grid stability to price to regulation. It’s about time that researchers started thinking about bitcoin mining from this understanding. Had the authors spent even a modest amount of time reading previously published literature, rather than operating in a silo like Sai and Vranken noted in their review paper, they might have at least addressed this limitation in their study.
—
So, I’ve never been to a honky tonk joint before. At least not until I found myself in a taxi cab with several other conferencegoers at the North American Blockchain Summit. Fort Worth, Texas, is exactly what you’d imagine. Cowboy boots, gallon-sized cowboy hats, Wrangler blue jeans, and cowboys, cowboys, cowboys everywhere you looked through the main drag. On a brisk Friday night, Fort Worth seemed frozen in time, people actually walked around at night. The stores looked like the kind of mom-and-pop shops you’d see on an episode of The Twilight Zone. I felt completely disoriented.
My companions convinced me that I should learn how to two-step. Me, your standard California girl, whose physics advisor once told her that while you can take the girl out of California, you can’t take California out of the girl, should two-step?! I didn’t know a two-step from an electric slide and the only country I remember experiencing was a Garth Brooks commercial I saw once on television when I was a child. He was really popular in the nineties. That’s about as much country as this bitcoin mining researcher gets. The place was filled with kitschy gift shops and bright lights everywhere radiating from neon signs. At the center of the main room, a bartender wearing a black diamond studded belt with a white leather gun holster and lined with evenly spaced silver bullets. Who the hell knows what kind of gun he was packing, but it did remind me of the guns in the 1986 film, Three Amigos.
It was here, against the backdrop of what sounded like a country band that wasn’t entirely sure that it was country, that I watched the Texas Blockchain Council’s Lee Bratcher address a ball with the kind of trigonometric grace that you could only find at the end of a cue and land that billiard in a tattered, leather pocket for what seemed like the hundredth time that night. The smooth clank of billiard against billiard awoke something inside me. I realized that I was not yet out of the rabbit hole that Frank sent me down. I remembered somewhere scribbled in my notes that I had not plotted the hashrate share over time for the countries mentioned in the UN study. So, at half past three in the morning, I threw my head back to take a swig of some club soda and bumped it against the wall of the photo booth where nuclear families could pose with a mechanical bull, and fell unconscious.
Three hours later, I was back in my hotel room. Thankfully, someone placed some worthless fiat in my hand, loaded me into a cab, and had the driver take me back to the non-smoking room I checked into at the very center of the decay of twenty-first-century business travel, the Marriott Hotel. Fuzzy-brained and bleary-eyed, I let the blinding, dangerously blue light from my computer screen wash over my tired face and increase my chances of developing macular degeneration. I continued my analysis.
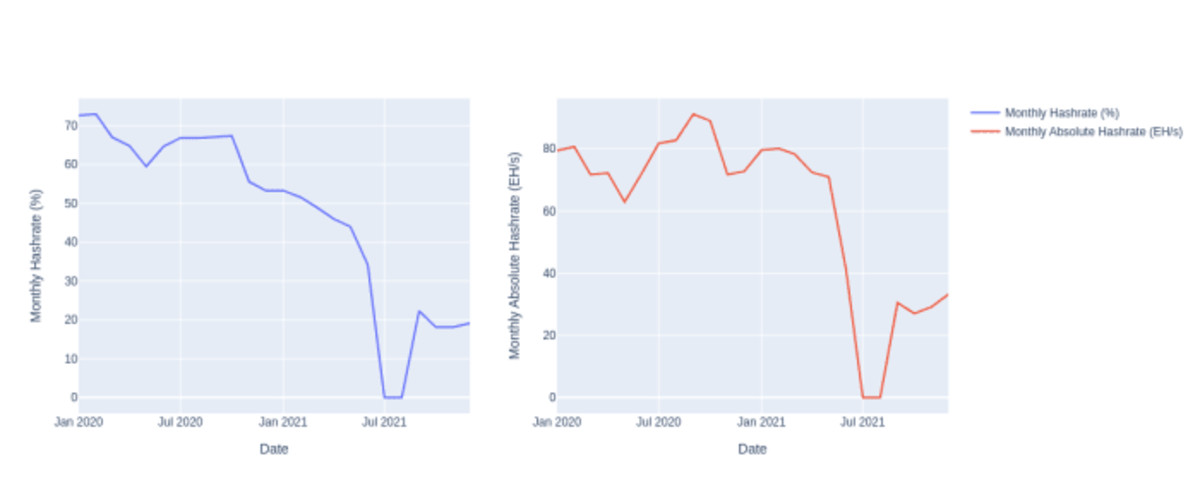
What follows are a series of plots of CBECI mining map data from January 2020 through January 2022. Unsurprisingly, Chamanara et al. focus attention on China’s contribution to energy use, and subsequently to its associated environmental footprint. China’s monthly hashrate peaked at over 70 percent of the network’s total hashrate in 2020. In July 2021, that hashrate share crashed to zero until it recovered to about 20 percent of the share at the end of 2021. We don’t know where it stands today, but industry insiders tell me it’s likely still hovering around this number, which means that in absolute terms, the hashrate is still growing there despite the ban.
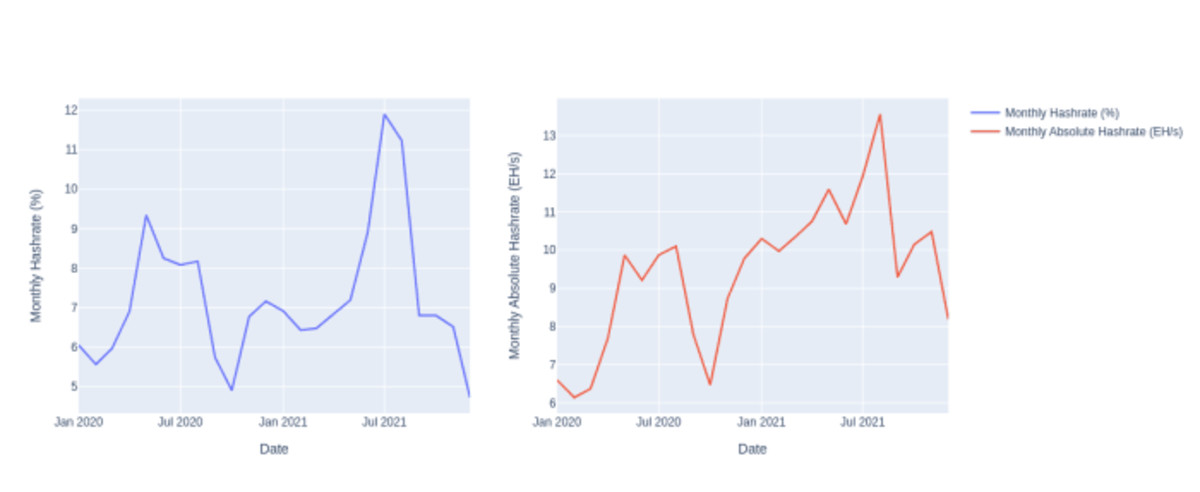
Russia, also unsurprisingly, gets discussed as well. Yet, based on the CBECI mining map data from January 2020 through January 2022, it’s hard to argue that Russia was an immediate off-taker of exiled hashrate. There’s certainly an immediate spike, but is this real or just miners using VPN to hide their mining operation? By the end of 2021, the Russian hashrate declined to below 5 percent of the hashrate and in absolute terms, declined from a brief peak of over 13 EH/s to a bit over 8 EH/s. When looking at the total year’s worth of CBECI estimated energy use for Russia, we do see that Russia did hold a significant portion of hashrate, it’s just not clear that when working with such a limited set of data, we can make any reasonable claims about the present contribution to hashrate and environment footprint for the network.
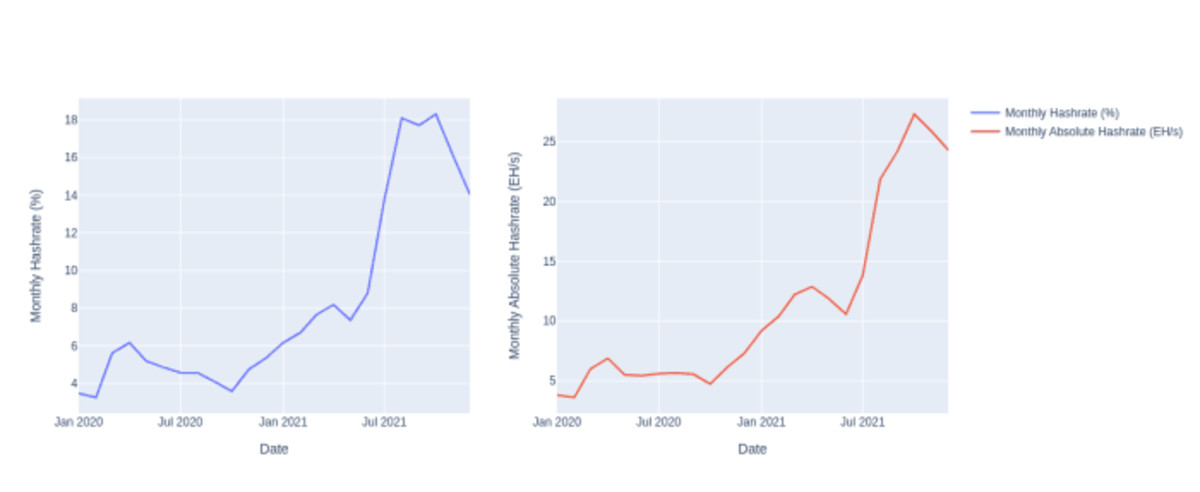
The most controversial discussion in Chamanara et al. deals with Kazakhstan’s share of energy use and environmental footprint. Obviously, the CBECI mining map data shows that there was a significant increase in hashrate share both in relative and absolute terms. It also appears that this trend started before the China ban was implemented, but certainly appears to rapidly increase just before and after the ban was implemented. However, we do see a sharp decline from December 2021 to January 2022. Was this an early signal that the government crackdown was coming in Kazakhstan?
In their analysis, Chamanara et al. ignored the recent Kazakhstan crackdown, where the government imposed an energy tax and mining licenses on the industry, effectively pushing hashrate out of the country. The authors overemphasized Kazakhstan as a current major contributor to bitcoin’s energy use and thus environmental footprint. If the authors had stayed within the limits of their methods and results, then noting the contribution of Kazakhstan’s hashrate share to the environmental footprint for the combined years of 2020 and 2021 would have been reasonable. Instead, not only do they ignore the government crackdown in 2022, but they also claim that Kazakhstan’s hashrate share increased by 34% based on 2023 CBECI numbers. CBECI’s data has not been updated since January 2022 and CCAF researchers are currently waiting for data from the mining pools that will allow them to update the mining map.
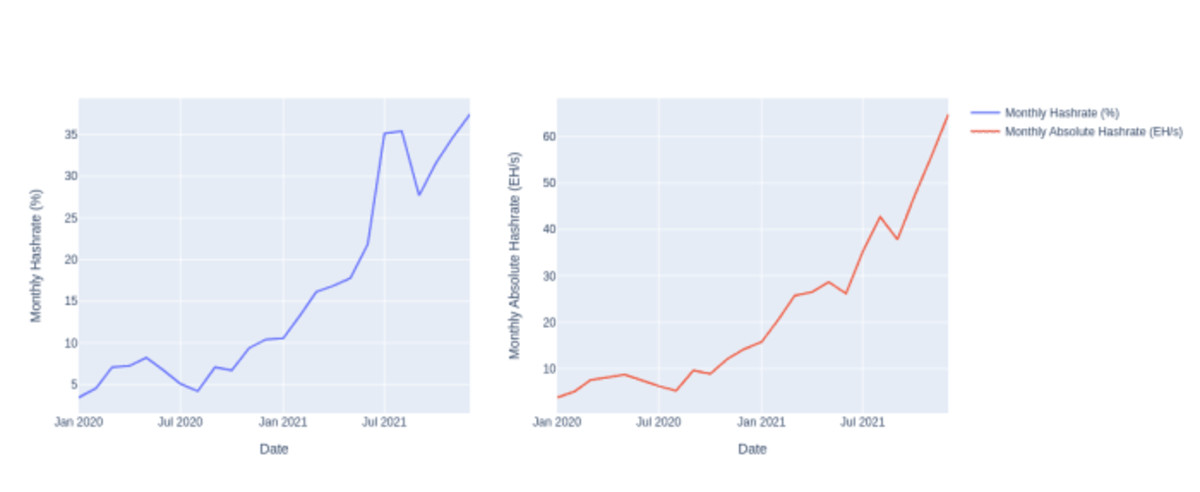
I know I’ve shown you, my faithful reader, a lot of data, but go ahead and have another shot of the hardest liquor you have in your cabinet, and let’s take a look at one more figure. This one represents the United States hashrate share in the older CBECI mining map data. The trend we see for the United States is also similar for Canada, Singapore, and what CBECI Calls “Other countries”, which represent the countries that did not make the top ten list for hashrate share. There’s a clear signal that reflects what we know to be true. The United States took a significant portion of Chinese hashrate and this hashrate share grew rapidly in 2021. While we know that the CBECI mining map data is limited to less than a majority of the network hashrate, I do think that their share is at least somewhat representative of the network’s geographic distribution. Hashrate geographic distribution seems to be heavily shaped by macro trends. While electricity prices matter, government stability and friendly laws play an important role. Chamanara et al. should have done this kind of analysis to help inform their discussion. If they had, they might have realized that the network is responding to external pressures at varying times and geographic scales. We need more data before we can make strong policy recommendations when it comes to the effects of bitcoin’s energy use.
—
At this point, I was no longer sure if I was a bitcoin researcher or an NPC, lost in a game where the only points tallied were for the intensity of self-loathing I was feeling for agreeing to this undertaking. At the same time, I could smell the end of this analysis was near and that, with enough somatic therapy and EMDR, I might actually remember who I used to be before I got dragged into this mess. Just two days prior, Frank and I had a falling out over whether Courier New was still the best font for displaying mathematical equations. I was alone in this rabbit hole now. I dug my fingers into the dirt walls surrounding me and slowly clawed my way back to sanity.
Upon exiting the hole, I grabbed my laptop and decided it was time to address the study’s environmental footprint methodology, wrap up this puppy, and put a bow on it. Chamanara et al. claimed that they followed the methods used by Ristic et al. (2019) and Obringer et al. (2020). There are a few reasons why their environmental footprint approach is flawed. First, the footprint factors are typically used for assessing the environmental footprint of energy generation. In Ristic et al., the authors developed a metric called the Relative Aggregated Factor that incorporated these factors. This metric allowed them to evaluate the placement of new electricity generators like nuclear or offshore wind. The idea behind this approach was to be mindful that while carbon dioxide emissions from fossil fuels were the main driver for developing energy transition goals, we should also avoid replacing fossil fuel generation with generation that could create environmental problems in different ways.
Second, Obringer et al. used many of the factors listed in Ristic et al. and combined them with network transmission factors from Aslan et al. (2018). This was a bad move because Koomey is a co-author on this paper, so it shouldn’t be surprising that in 2021, Koomey co-authored a commentary alongside Masanet where they called out Obringer et al. In Koomey and Masanet, 2021, the authors chided the assumption that short-term changes in demand would lead to immediate and proportional changes in electricity use. This critique could also be applied to Chamanara et al., which looked at a period when bitcoin was experiencing a run-up to an all-time high in price during a unique economic environment (low interest rates, COVID stimulus checks, and lockdowns). Koomey and Masanet made it clear in their commentary that ignoring the non-proportionality between energy and data flows in network equipment can yield inflated environmental-impact results.
More importantly, we have yet to characterize what this relationship looks like for bitcoin mining. Demand for traditional data centers is defined by the number of compute instances needed. What is the equivalent for bitcoin mining when we know that the block size is unchanging and the block pace is adjusted every two weeks to keep an average 10-minute spacing between each block? This deserves more attention.
Either way, Chamanara et al. did not seem to be aware of the criticisms of Obringer et al.’s approach. This is really problematic because as mentioned at the start of this screed, Koomey and Masanet laid the groundwork for data center energy research. They should have known not to apply these methods to bitcoin mining because while the industry has differences from a traditional data center, it’s still a type of data center. There’s a lot that bitcoin mining researchers can take from the torrent of data center literature. It’s disappointing and exhausting to see papers published that ignore this reality.
What more can I say other than this shit has to stop. Brandolini’s Law is real. The bullshit asymmetry is real. I really want this new halving cycle to be the one where I no longer have to address bad research. While I was writing this report, Alex de Vries published a new bullshit paper on bitcoin mining’s “water footprint”. I haven’t read it yet. I’m not sure that I will. But if I do, I promise that I will not write over 10,000 words on it. I’ve stated my case and made my peace with this genre of academic publishing. It was a fun ride, but I think it’s time to practice some self-care, treat myself to several evenings of healthy binge-watching, and dream of the ineffable.
—
If you enjoyed this article, please visit btcpolicy.org where you can read the full 10,000-word technical analysis of the Chamanara et al. (2023) study.
This is a guest post by Margot Paez. Opinions expressed are entirely their own and do not necessarily reflect those of BTC Inc or Bitcoin Magazine.
