
Ethereum price has moved up on its chart over the last 24 hours. The altcoin witnessed a 4% growth in the same time frame. This has pushed the price of the altcoin closer to the immediate resistance.
Once the Ethereum price moves above the closest resistance level, the bulls could definitely take control of the market. Technical indicators of the altcoin have pointed towards bullish signals.
However, it is too soon to say if the bulls will remain on the chart over the next trading sessions. Bitcoin price also logged minor gains, which have turned certain altcoins green over the last 24 hours.
In the last week, Ethereum price appreciated by 4%. This indicated that most of the gains made by the altcoin were registered over the last day.
The crucial price mark for the altcoin remains at $1,400. If the bulls can maintain their momentum, the altcoin could break through the $1,400 barrier in the coming trading sessions.
Buying strength has seen a considerable increase as ETH moved north over the last 24 hours.
Ethereum Price Analysis: One-Day Chart
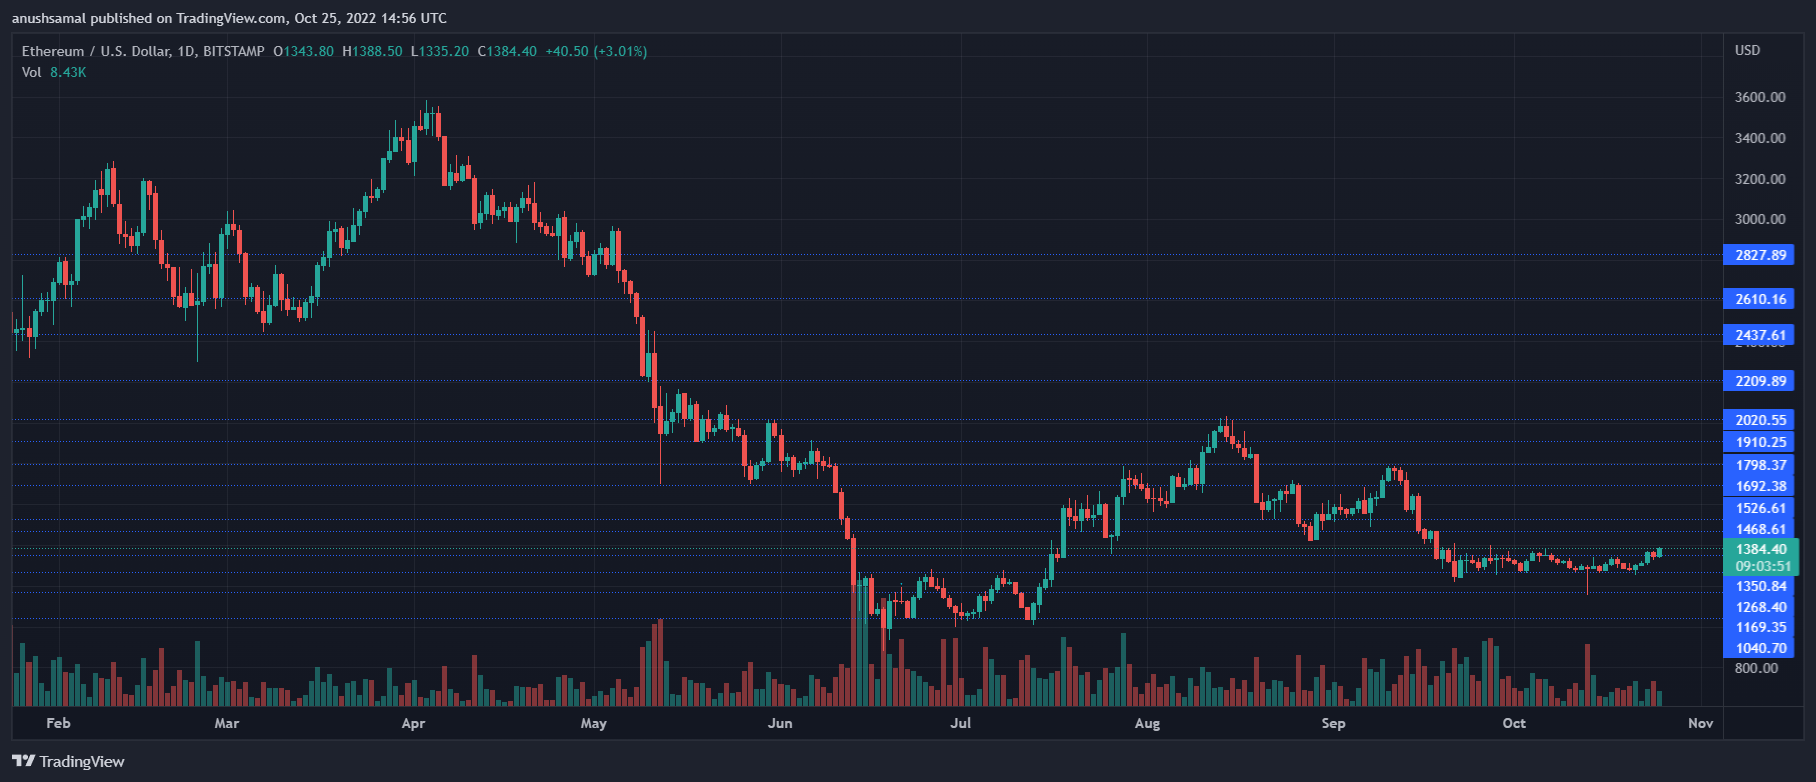
ETH was trading at $1,380 at the time of writing. The coin has finally moved upwards after a phase of consolidation. The bulls could push past the $1,400 level over the next trading session if they hold the momentum.
The bulls will gain further control if that level is crossed. The other resistance mark for the coin stands at $1,500. A move above the $1,500 level could propel the price of Ethereum to $1,680.
On the other hand, a small drop in price will bring Ethereum to $1,340 and then to $1,268. The amount of Ethereum traded in the last session increased, signifying bullish price action.
Technical Analysis
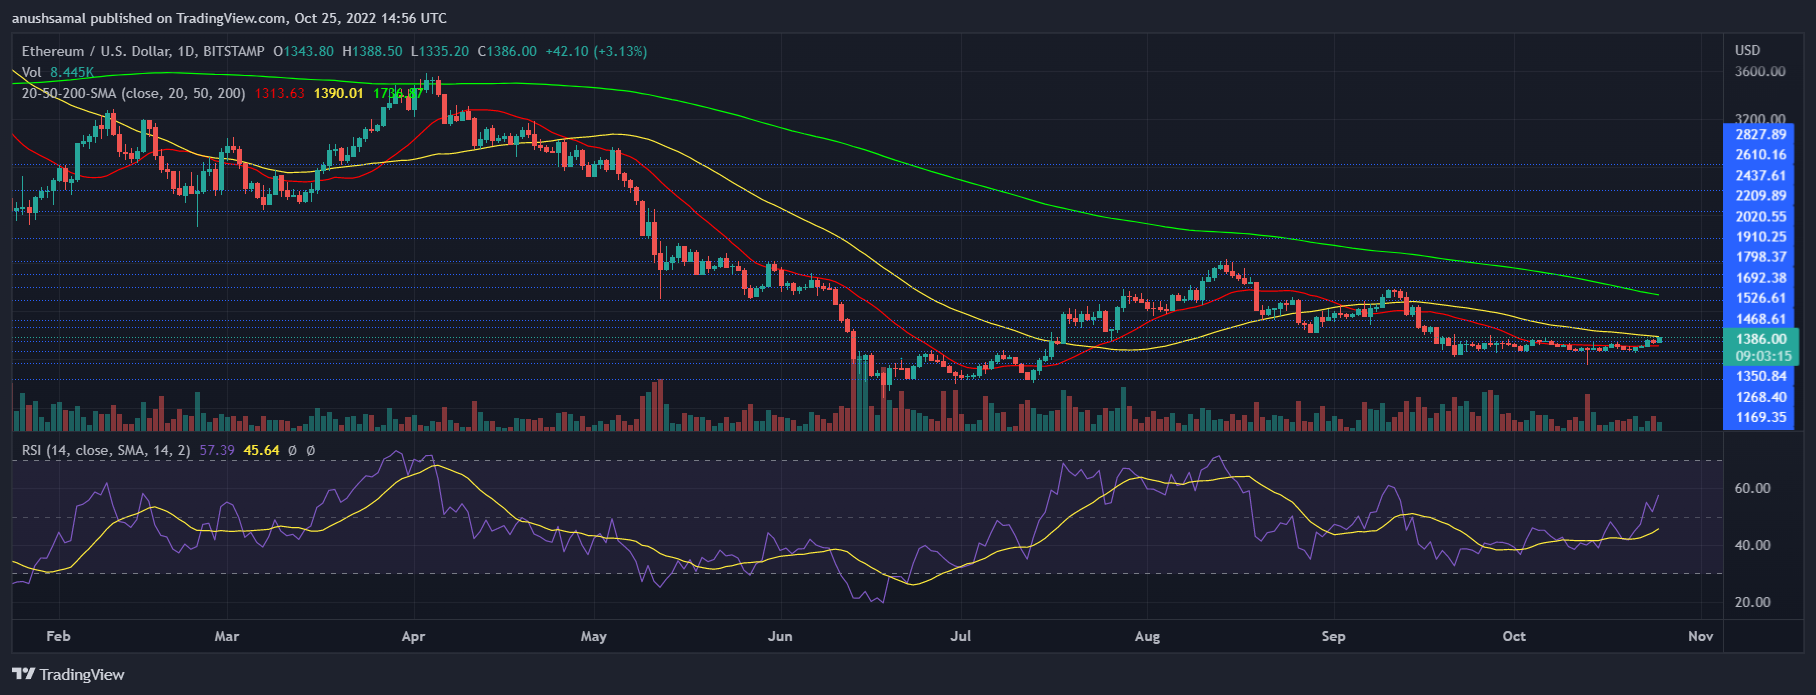
The altcoin’s northbound movement brought buyers back into the market. The technical indicators had signalled that the bulls had re-surfaced along with the buyers.
The Relative Strength Index zoomed above the half-line in an indication that buyers have outnumbered sellers in the market.
Ethereum price was above the 20-SMA, which meant that demand for the altcoin had increased and that buyers were driving the price momentum in the market.
The other technical indicators were also in accordance with the buyers. Ethereum had depicted buy signal on the one-day chart.
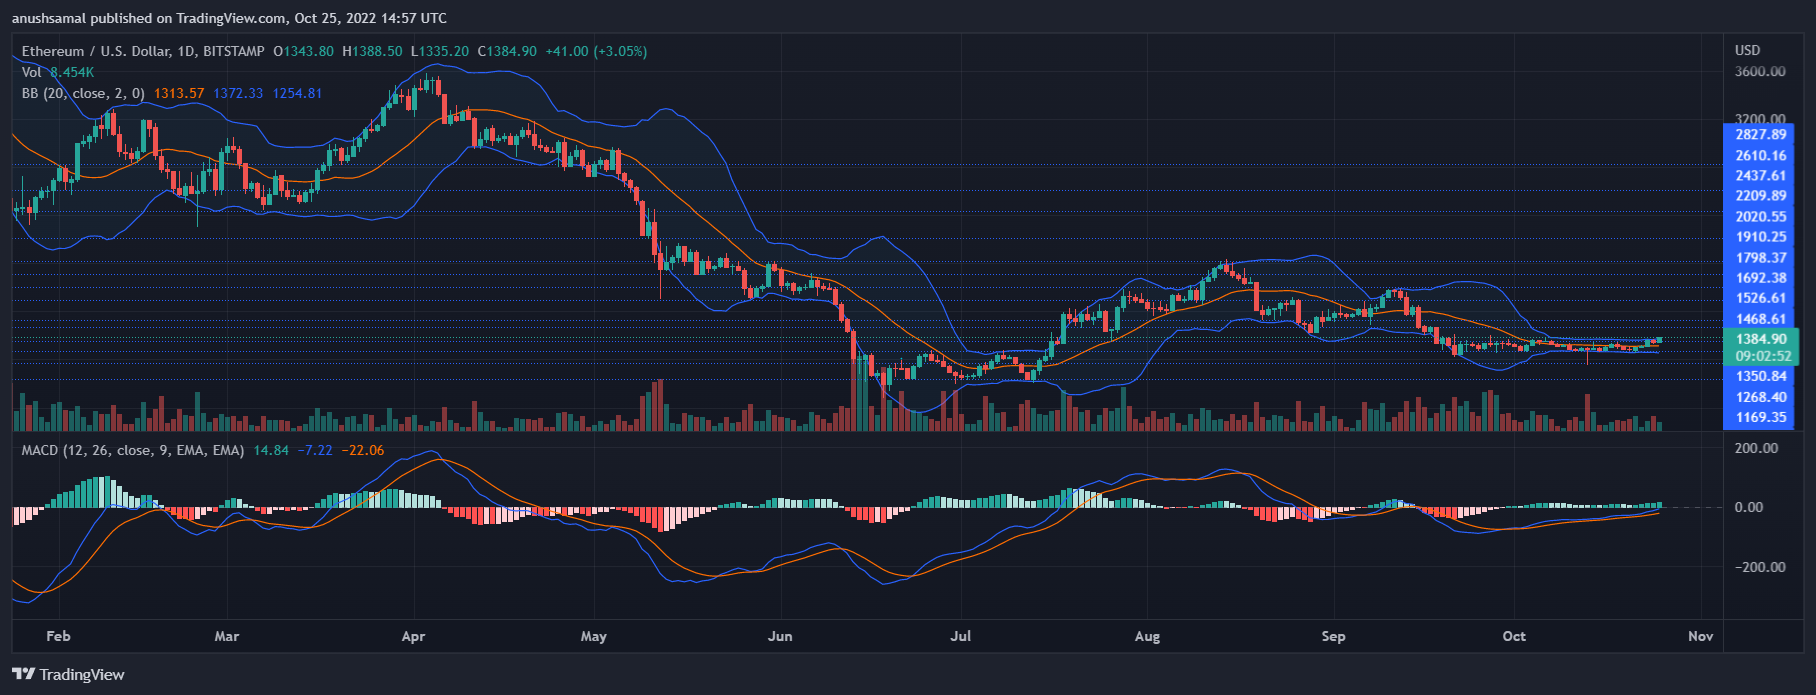
Moving Average Convergence Divergence indicates the price momentum and the overall price direction of the asset.
The MACD continued to display green signal bars above the half-line, which meant that there were buy signal for the crypto.
Bollinger Bands measure the price volatility and the chance of price fluctuation. The bands were super constricted and this reading is often associated with explosive price action.
