
Solana price witnessed a strong bearish pull as major market coins also depreciated significantly on their charts.
The altcoin fell by 6% over the last 24 hours. In the past week, Solana lost 14% of its market value.
The bulls were trying to defend the coin at their nearest support level, however, the coin met with a sell-off over the past 24 hours.
Over the last few days, Solana was trading sideways above its support level of $34. The recent depreciation on the chart caused SOL to fall below its immediate support level.
If Solana price continues to move on the same price trajectory, a fall below its present price level will be inevitable. The technical outlook for the coin pointed towards bearishness.
Selling strength shot up over the last 24 hours as buyers lost confidence. A move below the $31 price mark will cause SOL to revisit the $28 price level.
The global cryptocurrency market cap today is at $1.01 Trillion, with a 3.5% negative change in the last 24 hours.
Solana Price Analysis: Four-Hour Chart
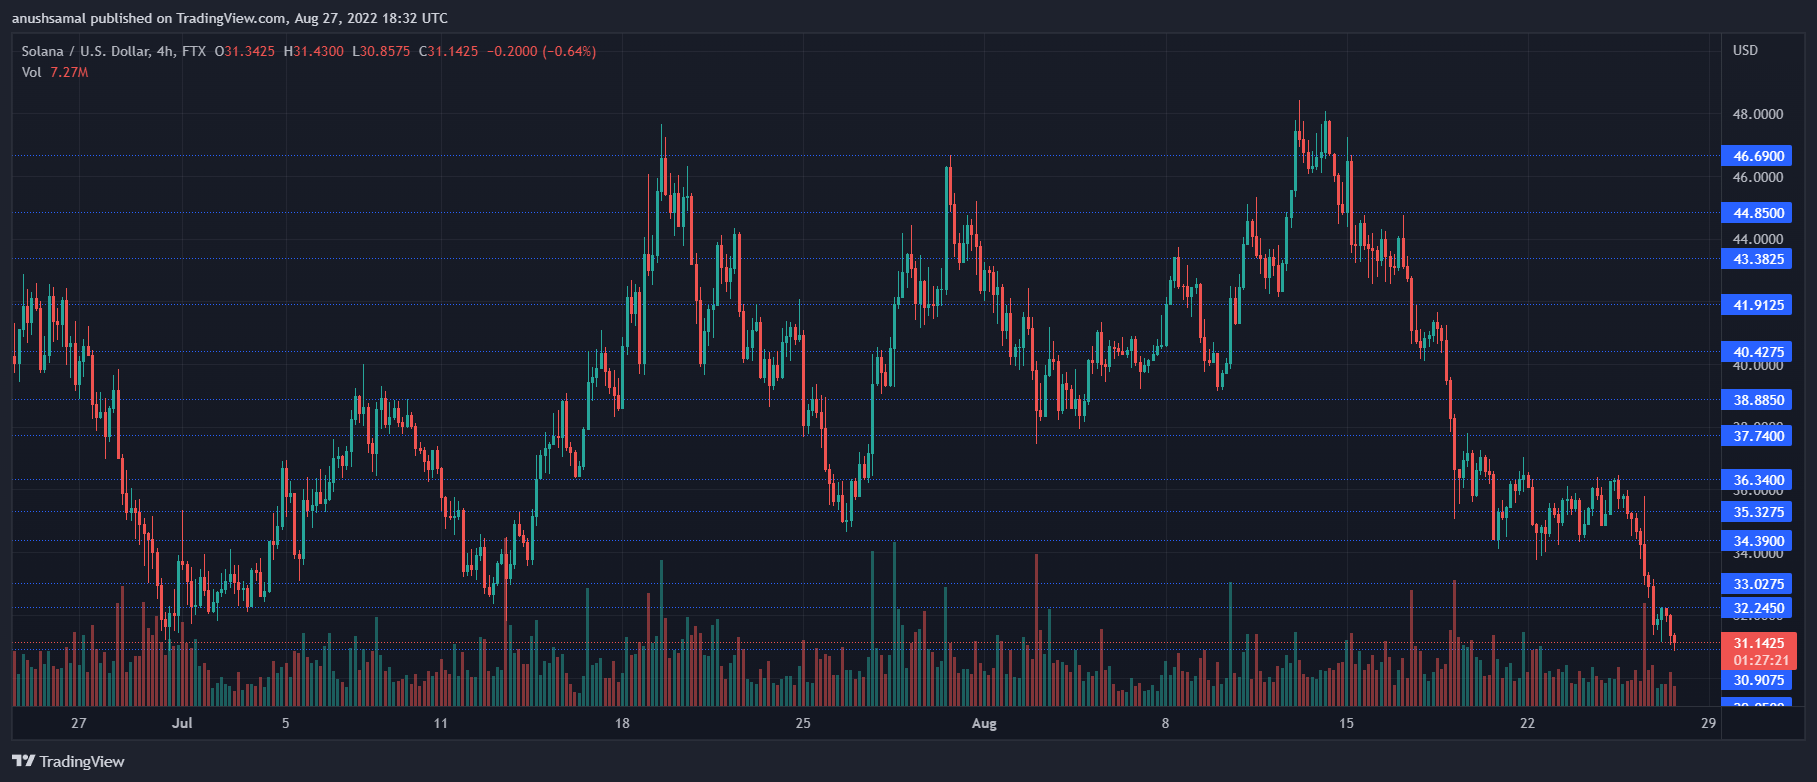
SOL was trading for $31 at the time of writing. The coin just lost the support of the $34 level and was eyeing the next support level.
The closest support line for the coin stood at $28. Overhead resistance for the coin stood at $37. In case the coin manages to revisit the $34 level, a move above that price level could be expected.
In case Solana price is unable to remain at its present level, a move below the $28 price mark can be expected over the immediate trading sessions.
The amount of SOL traded over the last session declined which indicated low demand levels and increased selling strength.
Technical Analysis
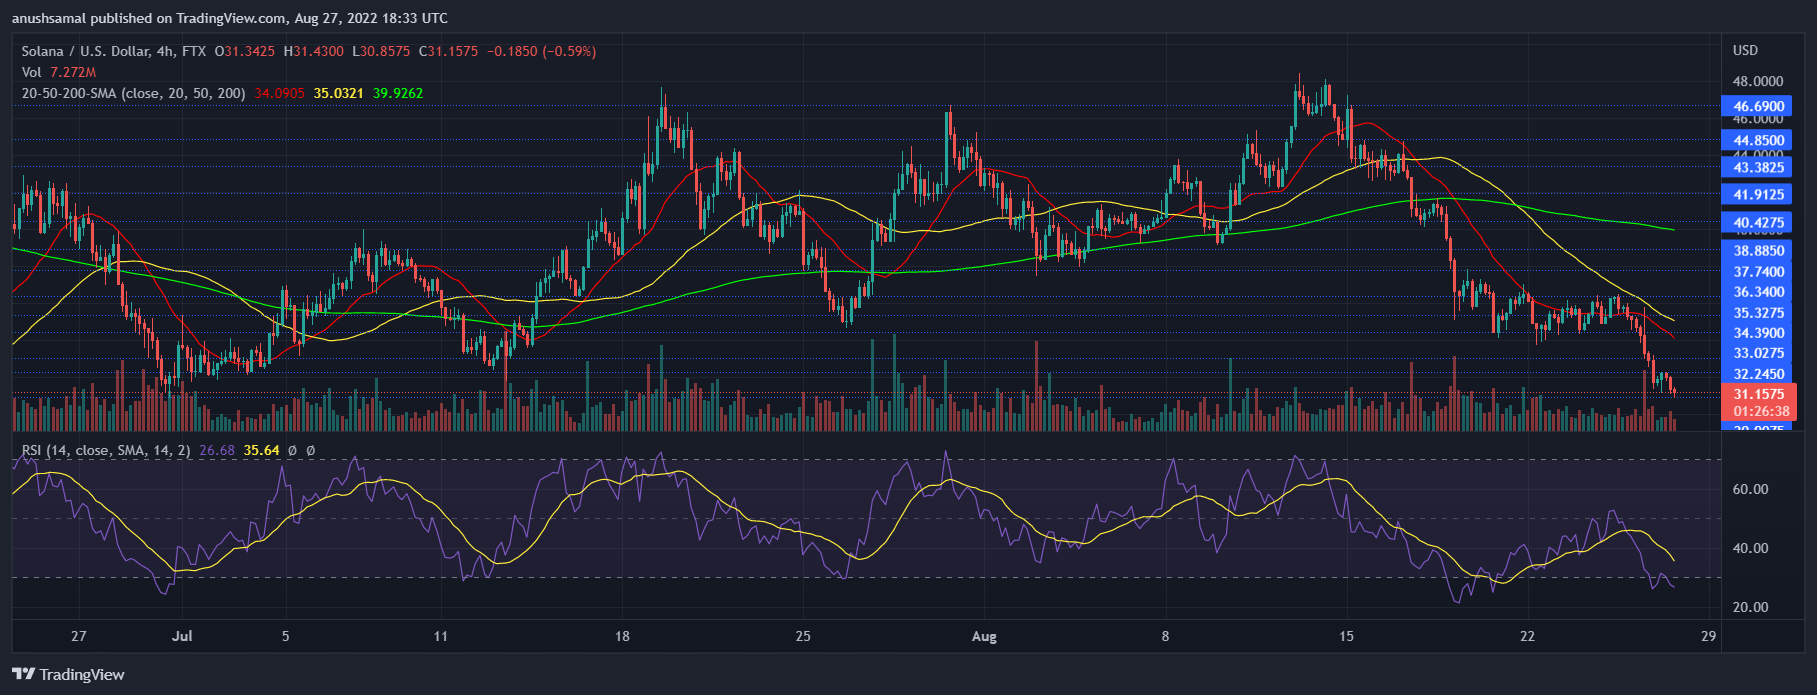
SOL depicted a fall in buying strength at the time of writing. The technical indicator pointed towards increased selling strength.
The Relative Strength Index was below the 20-mark which meant that sellers outnumbered buyers at the time of writing.
Due to lower demand, Solana was undervalued on the four-hour chart. Solana price was below the 20-SMA line and that meant sellers were driving the price momentum in the market.
SOL had depicted a sell signal on their four-hour chart. Technical indicators pointed towards incoming bearishness over the next trading sessions.
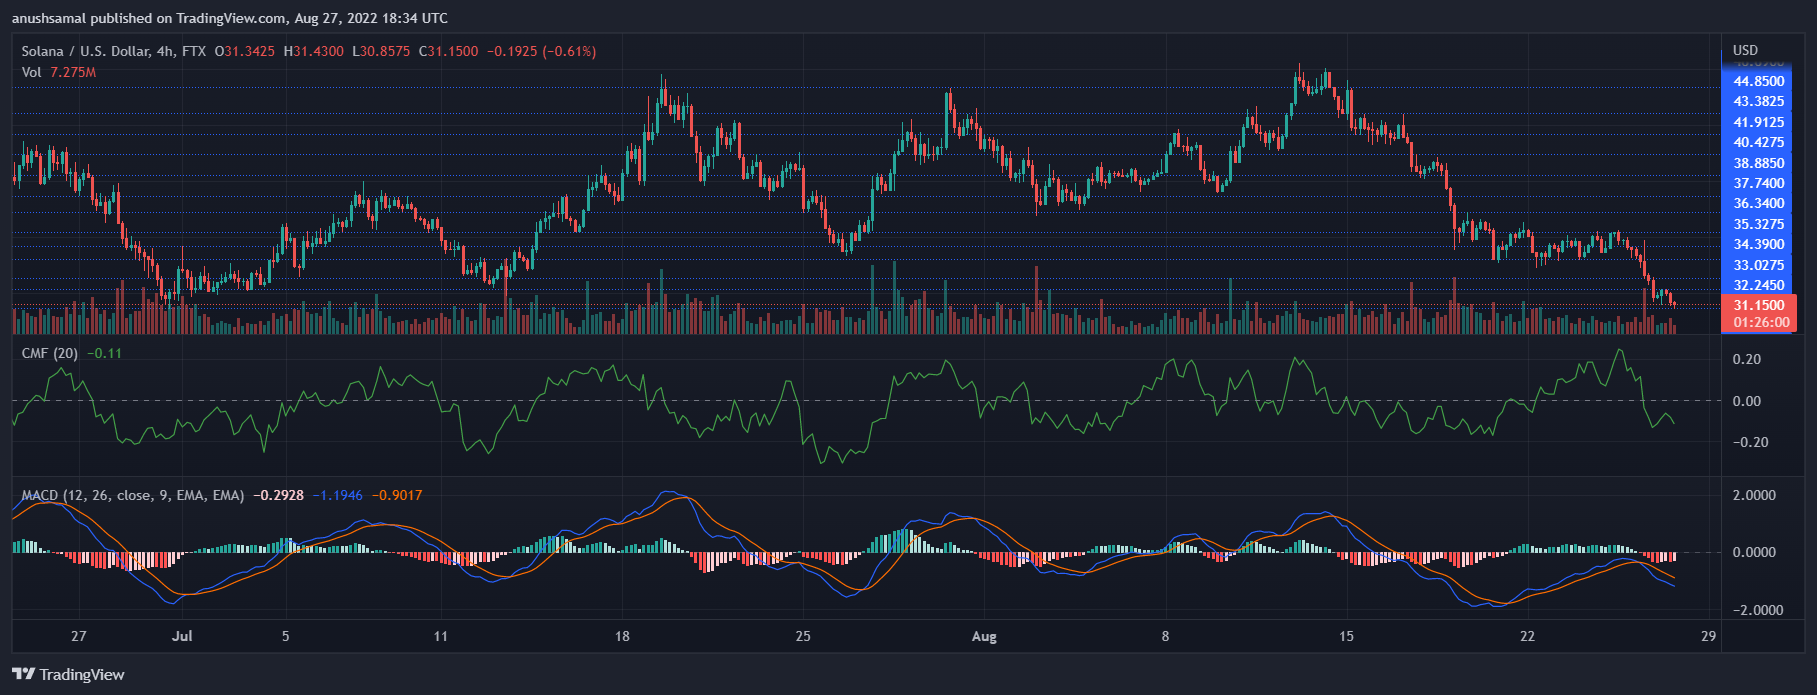
Moving Average Convergence Divergence indicates the price momentum and the chance of reversal.
MACD underwent a bearish crossover and it formed red signal bars below the half-line which were the sell signal for the coin.
Chaikin Money Flow displays capital outflows and inflows. CMF was also under the zero line which indicated a fall in capital inflows compared to outflows.
